Monday, November 11, 2019

Atlantic Storms And Hurricanes Are Not More Extreme Nor More Numerous

Atlantic Tropical Storms

The number of recent Atlantic Tropical Storms and Major Hurricanes have only increased slightly,and they have not been more severe than the Tropical Storms and Major Hurricanes of the Past.


The Total Number Of Tropical Storms In The Atlantic From 1851-2017

Climate change is not the cause of the Deaths, Injuries and Property Damage from the past few years.

There have been more Deaths, Injuries and Property Damage from Hurricanes in recent years, but that is because Humans insist on doing Stupid things. Building High rise structures on the beach where Hurricanes make Landfall on a regular basis is quite foolish. Having Homes and Businesses on these Beaches is a Disaster waiting to happen.

The number of Hurricanes in the Atlantic has been highly Variable since records have been kept. The variability in Hurricane Strength might be slightly greater now than it has been in the past, but the average number is similar. Attributing this to Climate Change does not really answer the question of what is happening and why. It could be a Temporary Phenomenon rather than a long term Phenomenon.

The Historical Records of Hurricanes in the Atlantic are probably incomplete and do not reflect the Strength of the Hurricanes relative to the measurement of the Strength of the Hurricanes as measured in the past 40-50 years.

Atlantic Hurricanes


Chart Of The Total Number Of Atlantic Hurricanes From 1851-2017

Tropical Storms and Hurricanes, sometimes Major Hurricanes, strike the Southeastern United States and the Gulf of Mexico on a regular basis. It is not a matter of IF a Hurricane or Major Hurricane is going to Strike, it is only a question of WHEN!

Atlantic Major Hurricanes 


Chart Of The Number Of Major Atlantic Hurricanes From 1851-2017

The 1950's and 1960's had almost as many Major Hurricanes as the 2000's. The 1930's had many Major Hurricanes. Claiming that Man-Made, Human Caused, Amthropogenic Climate Change is responsible when there is an unusual series of Weather Events, is not very Scientific, and only Confuses the Real Issue. There have been many periods in the past, recent and distant, where there were similar changes in the Weather Patterns. Some are still occurring, and some were temporary changes in the Weather Patterns.

Wednesday, October 23, 2019

Slaveholders Were Less Than 1.5% Of The Free Population In 1860

The 1860 United States Census indicates that Slaveholders were a very small part of the United States population at the start of the Civil War. The number of Slaveholders in the United States was 393,975, and the Total Free Population of the United States was 27,233,198.

The following Chart presents the full 1860 United States Census Data, including the Total Population, the Total Free Population, the Total Number of Slaves, the Number of Families and the Total Number of Slaveholders.


This Chart contains the data from the 1860 United States Census, and is a Column Chart of the total population, the total Free population, the total number of Slaves, the number of families and the total number of Slaveholders.


The 1860 United States Census also documents that the Slaveholdings of the 393,967 Southern Slaveowners were distributed as follows: 216,269 Slaveowners held 1-5 Slaves, 175,335 Slaveowners held 6-99 Slaves, 2,341 Slaveowners held 100-499 Slaves and 22 Slaveowners held 500+ Slaves.

This means that 55% of the Southern Slaveholders in 1860 owned 1-5 Slaves, 44.5% owned 6-99 Slaves, .6% owned 100-499 Slaves, and .006% owned 500 or more Slaves.


This Chart shows the number of Slaves that were owned by a Slaveholder based on various ranges of the number of Slaves owned.


This demonstrates that the majority of Southern Slaveowners were not Wealthy Plantation Owners, but probably Middle Class Factory owners, Tradesmen, Small Shipowners, or Small Companies that provided Services to other Companies or Organizations.

The Chart below shows the growth in the Southern Population in terms of the Whites, the Free Nonwhites and the Slaves from 1790 to 1860.


Chart of the population of the South based on the number of Whites, Free NonWhites and Slaves.


The number of Free Nonwhites increased at a greater rate than the number of Slaves. The number of Slaves was, of course, much greater than the number of Free Nonwhites. There were Twenty times as many Slaves in 1790 as there were Free Nonwhites, and there were more than Fifteen times as many Slaves in 1860 as there were Free Nonwhites.

The Original Thirteen Colonies population growth from 1750 to 1860 did not mirror the population growth of the South. The Northern Colonies/States White Population Growth offset the growth in the number of Slaves in the Southern Colonies/States.

The following Chart displays the White, Free Nonwhite and Slave Populations of the Original Thirteen Colonies in select years.


Chart of the White, Free NonWhite and Slave Population of the Original Thirteen Colonies/States.


This does not Justify or attempt to Rationalize the Enslavement of Africans, or any other Race, Ethnicity or Class of People. This is just a presentation of the Data that was gathered at that time.

The claims that ALL White people were responsible for the 250 years of Slavery in what is now the United States is absolutely False! Slavery deprived Hundreds of Thousands, if not Millions, of Poor Southerners a Job! They did not own Slaves, they were undoubtedly Anti-Slavery for basic Economic, and Survival, reasons.

They did not look at Slaves the same way that the Slave Holders did. They were afraid that the Slaves being sold today would take their job tommorrow. The harder they made it for the Slaves, the less qork that the Slaves could get done, and the more the Slaves would try to escape. If you are being jeered, and spit on, and treated in public as though you are less than Human, you will have an extra incentive to try and escape to a place that is not as cruel, and potentially deadly.

Sunday, July 7, 2019

The Overtly Racist Members Of Congress are ALL Democrats!


Congressional Democrats have been demanding that the Tech Industry supply them, and the Public, with the Demographics of their Companies. They Demand that these Companies Publish Reports of Inclusivity and Diversity at their Companies. The accusation is that the Tech Industry, with their High Paying Jobs, are excluding Women and "People of Color", in their hiring practices. The Industry is dominated by White Males and Asian Males, the same way that College Degrees, Bachelor's, Master's and Doctorates, are dominated by White and Asian Males.

These Members of Congress constantly decry Racial and Sexual Discrimination, typically in places where it does not exist, yet they are Proud to be members of Racially Disriminatory Groups!

All of the Members of the Congressional Black Caucus are Democrats. There have only been Two Republican Members of the Congressional Black Caucus in the History of the Organization. The current Congress, the 116th, only has two Black Republicans, Senator Tim Scott - South Carolina, and House Representative William Ballard Hurd - Texas 114th District. Neither of these Members of Congress are members of the Congressional Black Caucus.

Congressional Black Caucus


This is a List of the Members of the Congressional Black Caucus, with their Party Affiliation and State and District.


These Openly Racist Members of Congress are Proud of the fact that they are Racist, and engage in Racially Discriminatory Acts. They do not represent ALL of their Constituents, they only represent the Constituents that look like them!

They are also demanding that the Tech Industry start Recruiting and Hiring more Graduating Students from Historically Black Colleges and Universities(HBCU)! The Tech Industry needs the Best Engineers and Computer Scientists that they find. The Top Engineering Schools are well known, and these are the Colleges and Universities that the Tech Industry recruits at.

To force the Tech Industry to hire Engineers and Computer Scientists from Colleges and Universities that are Not the Top Colleges and Universities in the United States, and the World, is not only Racist and Racially Disriminatory, these requirements would cause a degradation in the Technical Superiority of these International Technology Companies. Hiring Less Qualified people is not going to benefit anyone!


Thursday, June 27, 2019

The Tech Industry Demographics Mirror The Engineering Graduate Demographics


Politicians and the Media are demanding that the Tech Industry hire more Non-Asian "People of Color" for their Technical positions. The number of Black and Hispanic people with Computer Science and Engineering Degrees does not match the Demographics of the United States. The demands that the Tech Industries Demographics should match the Demographics of the United States is just another example of the misleading claims that "People of Color" are not being given the same opportunities as White people and Asians.

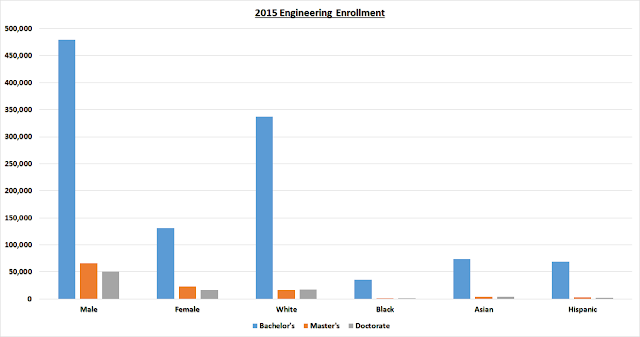
The following chart shows the number of students enrolled in Engineering by Sex and Race in 2015. It also includes the number of students, by Sex and Race, enrolled in Bachelors, Masters and Doctoral Programs. The enrollment data shows an overwhelmingly high number of White Male students versus the total number of Engineering students.

This is the Pool of available Engineers that the Tech Industry has to choose from. They cannot hire people that do not exist. If they try to achieve an employee ratio based on the United States Demographics, they would have to Racially and Sexually Discriminate in their Recruitment, Hiring, Compensation and Promotions practices. This, of course, would be a violation of Federal Laws against Discrimination.


This chart shows the number of Students Enrolled in Engineering in 2015 by Sex and Race, and by the number Enrolled in Bachelors, Masters and Doctoral Programs.


Politicians, the Media, the Schools and the School Counselors, should encourage students to pursue the appropriate High School courses, and counsel the students on the necessary coursework required to apply for admission to an Engineering or Computer Science Program. Complaining that the companies are not hiring people that do not exist is just another Political ploy to put pressure on the companies for something that is not their fault. It is the fault of the Politicians, who for Decades have not done anything to improve the local school systems in historically Poor neighborhoods. They have spent all of their time trying to play the Blame Game.


The following Chart shows the 2011 Technical Employment by Sex. It includes the Total United States Employment by Sex, the Computer Occupations Employment by Sex and the Engineering Occupations Employment by Sex.


Chart of the 2011 Total Employment, Engineering Occupations Employment and Computer Occupations Employment by Sex.


The 2011 Technical Employment by Race also shows an overwhelmingly White workforce in the Engineering and Computer Science Fields. The following Chart illustrates this very clearly.


Chart of the Percent of the Total United States Employees, Computer Occupations Employees and Engineering Occupations Employees.


The number of Engineering Degrees Awarded in 2015 categorized by Sex and Race again shows the that the Engineering Profession is overwhelmingly White and Male. There is nothing Racist or Sexist about this. The number of students entering College and Majoring in Engineering continues to be dominated by White Males. When these White Males graduate from College with their Engineering Degrees, the Tech Companies are there to hire them. The Tech Companies, and other Industries that require Engineers, will offer them very competitive Salaries.

The following Chart shows the number of Engineering Degrees awarded in 2015 broken out by Sex and Race. It also shows the breakdown of the number of Bachelors, Masters and Doctoral Degrees awarded by Sex and Race. The advanced Degrees are also dominated by White Males.


The number of Engineering Degrees, Bachelors, Masters and Doctoral Degrees, awarded based on Sex and Race in 2015.


The Racial breakdown of Engineering Professors in 2015 were 64% White, 2.7% Black, 29% Asian, and 4.2% Hispanic. The following chart shows the number of Engineering Professors by Race, and is broken out by the number of Assistant Professor, Associate Professor and Full Professor. White Professors vastly outnumber any other Race in the field of Engineering Professors. This is not unusual, since there are more White people in the Engineering field than any other Race, and therefore would also dominate the number of people in this Profession.


Chart of the number of Engineering Professors by Race, and by Assistant Professor, Associate Professor and Full Professor.


The Tech Industry can not hire people who do not exist. The available number of Engineers is determined by the number of students who choose and complete a College Engineering Program. That is determined by the early education and High School education, opportunities, counseling, encouragement and desires of the Students. You can not Legislate College choices to try and force the Demographics of the Tech Industry, or any Industry, to match the Demographics of the United States.

Sunday, June 23, 2019

The 2nd Amendment Has Been Obsolete For More Than One Hundred Years!

The 2nd Amendment to the United States Constitution states that "A well regulated Militia, being necessary to the security of a free State, the right of the people to keep and bear Arms, shall not be infringed."

The first Militias were organized in the Massachusetts Bay Colony on December 13th, 1636 to defend against the growing threat of the Pequot Indians.

The Militia tradition meant citizens organizing themselves into Military units, responsible for their own defense. The members of the Militias were responsible for supplying their own firearms, ammunition and any other miscellaneous equipment necessary to fulfill their duty as Militia members.

The First Militia Act of 1792, passed May 2, 1792, authorized the President of the United States to call out the Militias of the several states, "whenever the United States shall be invaded, or be in imminent danger of invasion from any foreign nation or Indian Tribe".

The Second Militia Act of 1792 States that all Militia members shall provide themselves with "a musket, bayonet and belt, two spare flints, a box able to contain not less than 24 suitable cartridges, and a knapsack. Or, those enrolled, were to provide himself with a powder horn, 1/4 pound of gunpowder, 20 rifle balls, a shot-pouch, and a knapsack."

The Militia Acts were passed after the significant United States losses at St. Clair's defeat in 1791. St. Clair's defeat was blamed in part on the poor organization and equipment of the Army.

Article I, Section 8: Clause 15 of the United States Constitution gives Congress the power to pass laws for "calling forth the Militia to execute the Laws of the Union, suppress Insurrections and repel Invasions."

Article II, Section 2 of the United States Constitution designates the President of the United States as the Commander-In-Chief of the State Militias "when called into the actual Service of the United States."

The Militia Act of 1903, Section 4 states: "That whenever the United States is invaded, or in danger of invasion from any foreign nation, or of rebellion against the authority of the Government of the United States, or the President is unable, with the other forces at his command, to execute the laws of the Union in any part thereof, it shall be lawful for the President to call forth, for a period not exceeding nine months, such number of the Militia of the State or of the States or Territories or of the District of Columbia as he may deem necessary to repel such invasion, suppress such rebellion, or to enable him to execute such laws, and to issue his orders for that purpose to such officers of the Militia as he may think proper."

The Militia Act of 1903, Section 13 states: "That the Secretary of War is hereby authorized to issue, on the requisitions of the Governors of the several States and Territories, or of the Commanding General of the Militia of the District of Columbia, such number of the United States standard service magazine arms, bayonets, bayonet scabbards, gun slings, belts, and such other necessary accouterments and equipments as are required for the Army of the United States, for arming all of the organized Militia in said States and Territories and District of Columbia, without charging the cost or value thereof..."

The National Defense Act of 1916 authorized the President to mobilize the National Guard in case of War or other National Emergency, for the duration of the event.

Private Militias have not been a part of the United States Defense System for more than one hundred years. The Legal Militias in the United States are supplied Guns, Ammunition, and anything else that they need to perform thier duties. The 2nd Amendment, which was necessary to allow the people to have the necessary weapons when called upon to protect the States, or Federal interests, has not been needed for more than one hundred years.

To claim that you have the "Right to Bear Arms", is taking the 2nd Amendment to a place that it was never intended to go. People are buying and possessing guns to come together in a common defense of their State or the United States, here or on Foreign Soil.

Sunday, January 27, 2019

Deporting Criminals Is Not Anti-Immigrant


The Media’s misinformation machine is still trying to claim that Deporting people in the country Illegally is Anti-Immigration. They are still claiming that President Trump is Anti-Immigrant because he is enforcing Immigration Law.

President Obama was called the Deporter-In-Chief because of his Deportation Policies and Actions.

The Extremely Biased Media keeps comparing the number of deportations since Donald Trump has become President, with President Obama’s deportations in 2016. This is extremely misleading, because President Obama reduced the number of deportations in 2016 for Political reasons.

He did not want the Democratic Candidate for President to be “Saddled” with his Aggressive enforcement of Immigration Law, so he scaled back the enforcement of Federal Laws on Illegal Immigration and Overstaying Visas.

Entering the country without authorization is a Misdemeanor. Being in the country without authorization is another Misdemeanor. Re-entering the country after being Deported is a Felony.

The Media intentionally “confuses” the issue by claiming to “talk” about one Immigration issue while using the Data/Information from another Immigration issue. Overstaying a Visa is not the same as entering the country illegally. They are two very different issues with two very different solutions.

The people that have entered the country illegally are committing more crimes while they are in the country illegally. The claim that they are Law Abiding people is of course False. They have to pay rent, buy food and other necessities.

Since they cannot legally work, the only way that they can pay these bills is by committing Crimes. The crimes may be “conventional” crimes such as Theft, Burglary, Robbery, Auto Theft, Drug Dealing, etc., or they may be crimes such as Identity Theft to find employment under someone else’s name. They are all crimes, none the less. Working, and getting paid, “under the table”, in cash, is also illegal if you do not pay income taxes on the income.

The media likes to portray Undocumented Immigrants as Victims of a Racist segment of society, and claim that Immigrant communities have lower crime rates, and that they are Model Citizens. They don’t necessarily have lower crime rates, but they do have a lower Reported Crime Rate. There is a Big difference.


Tuesday, January 8, 2019

Maxine, Tech Cannot Hire People Who Do Not Exist


Rep. Maxine Waters(D-CA) and the Congressional Black Caucus are demanding that the Tech Industry hire more Black Engineers and Computer Scientists. They claim that until the number of Blacks equals the percentage of the General United States Population of Blacks, the Companies are not doing their job of Inclusivity and Diversity.
 
 The College Degrees that are required for these Positions are some of the most Academically demanding Curricula of any College Degrees.
 
The Percentage of College Students pursuing Degrees in Electrical Engineering is a small percentage of the Total number of College Students enrolled at any given time. 
 
Figures 1 and 2 are the data from the United States Census Bureau’s 2011 American Community Survey. It is comprised of the Civilians employed aged 25-64.
 
The Breakdown in Percentage of the Workforce by Race, of the Total US Workforce, the Engineering Workforce and the Computer Workforce, is shown in Figure 1.
 
This Chart shows the 2011 Total US Employment, Employment in Engineering and Computer Science as a Percent by Race.


The Total US Workforce is Two Thirds White, which is reflected in the Percentage of Whites in Computer Occupations and Engineering Occupations. The Percentage of Blacks and Hispanics in the Total US Workforce versus the Percentage of Blacks and Hispanics in Computer and Engineering are similar, about 50-70% of the Total Workforce numbers for each group.

The Breakdown in Percentage of the Workforce by Sex, of the Total US Workforce, the Engineering Workforce and the Computer Workforce, is shown in Figure 2.


This Chart shows the 2011 Total US Employment, and the Engineering and Computer Science Employment in Percent by Sex.


The number of Graduates receiving Bachelor’s Degrees, Master’s Degrees and Doctoral Degrees in Engineering in 2015 are listed in Figure 3, broken down by Race and Sex. The numbers, based on Race, do not reflect the breakdown of the General Population. There were only 172 Doctoral Degrees in Engineering Awarded to Black People in 2015. These numbers do not include Foreign Students.
 
This Chart shows the number of Engineering Degrees Awarded, Bachelors, Masters and Doctorate, by Race.


For Maxine Waters and the Congressional Black Caucus to demand that these Companies hire more Blacks would require the Companies to engage in Racially Discriminatory Hiring Practices. Their Threats of Regulatory Retaliation over these Racist Demands is Extremely Unprofessional and should NOT be Tolerated in our Elected Officials.
 

Racist Black Guy Calls Asian Hispanic Man A White Supremacist


A man was sitting by himself at a Menchies Yogurt Shop in Kirkland Washington, and had not ordered nor purchased anything. He was watching a woman and young boy at an adjacent table for about 30 minutes, when the employees became concerned/scared because all he did was look at his phone, look at them, look at his phone, look at them.

They called the Owner/Franchisee and asked him what they should do. The Owner/Franchisee, an Asian Hispanic Man, called 911 and reported the situation to the Police.

The Store, and the Area, have had problems with Homeless People, Drug Use, and a Robbery. There are almost 12,000 Homeless people in King County, and Kirkland has the highest Crime Rate among adjacent Cities.


This Chart shows the Kirkland Washington population by Race vs the Percent of the Population living in Poverty by Race.


Why wasn’t he wearing his County Identification around his neck as most City and County Employees do when they are at Work?

Why didn’t he talk to the person in charge and let her know that he was there Supervising a visit between the woman and the boy? That would have been the Professional thing to do.

Why didn’t he immediately show the Police his County Identification and explain to them why he was there Hanging Out, without buying anything?

Walking into the Store at the same time does not mean that they are together.

Byron Ragland, the Unprofessional Racist County Employee, is claiming that Ramon Cruz, with a Hispanic name, the Franchise Owner of Asian Descent, is a White Supremacist! WHAAAAT?

How could an Asian Hispanic Man be a White Supremacist? He is a Person Of Color just as Byron Ragland is a Person Of Color. The Major Difference is that Byron Ragland is an Angry Racist, and Ramon Cruz is a Successful Businessman.

Ragland's lawyer claims that "code" is often used during 911 calls while describing people of color to justify removing them from public areas. "CODE"? What kind of "code"? This sounds quite bizarre and is undoubtably another excuse to accuse a Hispanic-Asian person of Racism.

He also claims that it is important to point out that the employees did not interact with Ragland before calling the Police. That would be "Standard Procedure" in many situations. He was obviously not a customer, and they have had problems with Homeless People and Robberies in the past. The employees are not going to confront someone under these circumstances. Was it because he is Black? No. It was because he was acting suspiciously.

This chart shows the percent of Kirkland Washington residents by Race versus the percent living in Poverty by Race.


Byron Ragland wants the City of Kirkland to not renew Cruz’s Business license when it comes up for Renewal. The Local NAACP President, Gerald Hankerson, went to Menchies to Protest. Byron Ragland wants to Buy the 3 Menchies that Ramon Cruz owns.

Is that his Motivation for making all of these Racist statements, and calling the NAACP? He says that he and his Family cannot Sleep at Night. Why not? He should look at the situation from the Viewpoint of the Employees, and the Area that they were in. But of course he won’t do that, it would not fit his Racist Agenda. His Attorney, James Bell, is also claiming that the Incident was Racially Motivated.

Friday, January 4, 2019

Los Angeles Rainfall Patterns Have Not Changed In 140 Years

California's recent drought was the worst drought in 1200 years. Southern California is a Semi-Arid Region, and typically receives very little rain.

Los Angeles Rainfall


The recent drought was not much different than the other droughts, low rainfall years, that have occurred in the last 140 years in the Los Angeles area. The Average Rainfall for Los Angeles is slightly less than 15 inches, but that number is Skewed Upward by the years that Los Angeles receives an extremely large amount of rain.


Los Angeles Civic Center Rainfall Chart By Range Of Rainfall: Inches Per Year.


The rainfall in 81.6% of the last 141 years has been less than 20 inches. The 18.4% of the years that have produced more than 20 inches of rain have increased the average to a level well above the "Typical" amount of rainfall that the Los Angeles area receives.

One of the patterns that emerges from the Chart below is that every 15-25 years, Los Angeles receives less than 10 inches of rain for several years in a row, or they receive several years of less than 10 inches of rainfall, and one year of of rainfall above 10 inches. The recent 5 year Drought followed this Pattern just as the other Droughts have followed this Pattern.


Bar Chart Of The Yearly Rainfall At The Los Angeles Civic Center With A Line Chart For The 141 Year Average


Another Pattern is several years below 10 inches, and then one or two years above 15 inches. Almost one third, 29.1%, of the last 141 years have had less than 10 inches of rainfall.

The Decadal Rainfall Patterns show the same Phenomenon. Several years of Low Rainfall followed by several years of Higher Rainfall.

the Rainfall At The Los Angeles Civic Center Grouped By The Average Rainfall Each Decade


El Nino And La Nina


The high rainfall years are sometimes produced by an El Nino Event, but not all of the high rainfall years are caused by an El Nino Event. El Nino Years are very difficult to predict, including in the fall of the year that the conditions seem to be 'Right' for an El Nino Event. There have been years that the National Weather Service and other Weather Forecasting Services have predicted an El Nino or La Nina, but the Event did not Materialize.

The Drought years are sometimes caused by a La Nina Event, but are also caused by other phenomena. The Jet Stream being diverted North of California by a High Pressure System over Nevada, Idaho and Utah has caused many Severe Droughts, some lasting several years, in California. This type of Phenomenon has been ocurring for Thousands of Years, and is not a recent Man-Made or Human Caused Climate or Weather Event.

A Chart Of All Of The El Nino And La Nina Events Since 1951

Claiming that the recent Drought(s) are caused by Man-Made, Human Caused Anthropogenic Climate Change is just the Politically Correct thing to say. What caused the Droughts Decades ago? What caused the Drought 80 years ago? What caused the Drought 1200 Years Ago? The Pattern of Droughts and Heavy "Recovery" Rainfall have occurred on a regular basis for the last 140 years.