I write about topics of interest, current events, and any Social, Political, Scientific or other important topic that needs to be addressed in a Rational manner.
Thursday, June 27, 2019
The Tech Industry Demographics Mirror The Engineering Graduate Demographics
Politicians and the Media are demanding that the Tech Industry hire more Non-Asian "People of Color" for their Technical positions. The number of Black and Hispanic people with Computer Science and Engineering Degrees does not match the Demographics of the United States. The demands that the Tech Industries Demographics should match the Demographics of the United States is just another example of the misleading claims that "People of Color" are not being given the same opportunities as White people and Asians.
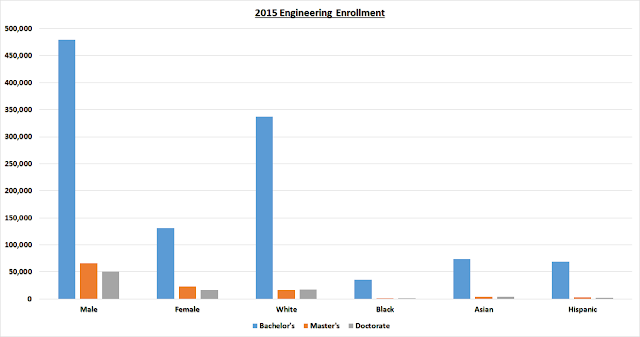
The following chart shows the number of students enrolled in Engineering by Sex and Race in 2015. It also includes the number of students, by Sex and Race, enrolled in Bachelors, Masters and Doctoral Programs. The enrollment data shows an overwhelmingly high number of White Male students versus the total number of Engineering students.
This is the Pool of available Engineers that the Tech Industry has to choose from. They cannot hire people that do not exist. If they try to achieve an employee ratio based on the United States Demographics, they would have to Racially and Sexually Discriminate in their Recruitment, Hiring, Compensation and Promotions practices. This, of course, would be a violation of Federal Laws against Discrimination.
Politicians, the Media, the Schools and the School Counselors, should encourage students to pursue the appropriate High School courses, and counsel the students on the necessary coursework required to apply for admission to an Engineering or Computer Science Program. Complaining that the companies are not hiring people that do not exist is just another Political ploy to put pressure on the companies for something that is not their fault. It is the fault of the Politicians, who for Decades have not done anything to improve the local school systems in historically Poor neighborhoods. They have spent all of their time trying to play the Blame Game.
The following Chart shows the 2011 Technical Employment by Sex. It includes the Total United States Employment by Sex, the Computer Occupations Employment by Sex and the Engineering Occupations Employment by Sex.
The 2011 Technical Employment by Race also shows an overwhelmingly White workforce in the Engineering and Computer Science Fields. The following Chart illustrates this very clearly.
The number of Engineering Degrees Awarded in 2015 categorized by Sex and Race again shows the that the Engineering Profession is overwhelmingly White and Male. There is nothing Racist or Sexist about this. The number of students entering College and Majoring in Engineering continues to be dominated by White Males. When these White Males graduate from College with their Engineering Degrees, the Tech Companies are there to hire them. The Tech Companies, and other Industries that require Engineers, will offer them very competitive Salaries.
The following Chart shows the number of Engineering Degrees awarded in 2015 broken out by Sex and Race. It also shows the breakdown of the number of Bachelors, Masters and Doctoral Degrees awarded by Sex and Race. The advanced Degrees are also dominated by White Males.
The Racial breakdown of Engineering Professors in 2015 were 64% White, 2.7% Black, 29% Asian, and 4.2% Hispanic. The following chart shows the number of Engineering Professors by Race, and is broken out by the number of Assistant Professor, Associate Professor and Full Professor. White Professors vastly outnumber any other Race in the field of Engineering Professors. This is not unusual, since there are more White people in the Engineering field than any other Race, and therefore would also dominate the number of people in this Profession.
The Tech Industry can not hire people who do not exist. The available number of Engineers is determined by the number of students who choose and complete a College Engineering Program. That is determined by the early education and High School education, opportunities, counseling, encouragement and desires of the Students. You can not Legislate College choices to try and force the Demographics of the Tech Industry, or any Industry, to match the Demographics of the United States.
Martin. P. Carva is my Nom de Plume. I am an Electrical Engineer and Materials Scientist. I have worked as a Control Systems Engineer, and in various roles in the Silicone Elastomers Field, with both Raw Material Suppliers and Fabricators.
Subscribe to:
Post Comments (Atom)


No comments:
Post a Comment